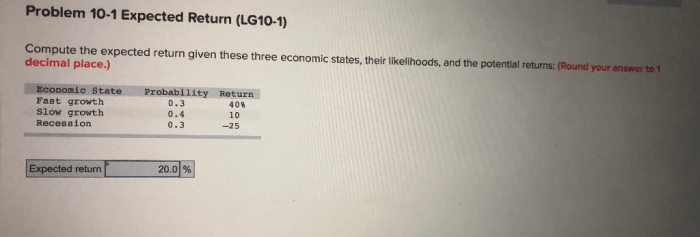
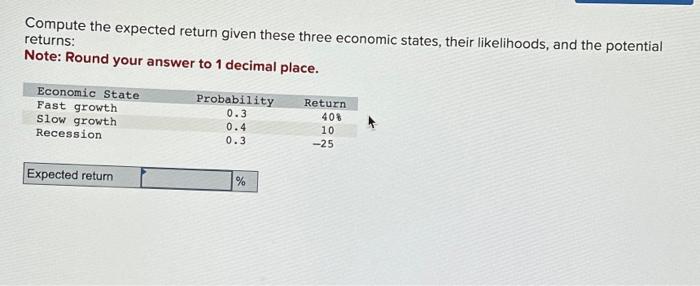
Compute the expected return given these three economic states. Expected return is a fundamental concept in economic analysis and investment decision-making. It provides a measure of the average return that an investment is expected to generate over time, taking into account the probability of different economic outcomes.
This article will guide you through the steps involved in calculating expected return, discuss its importance in investment analysis, and explore the limitations and assumptions associated with expected return calculations.
Introduction to Expected Return Calculation: Compute The Expected Return Given These Three Economic States

Expected return is a crucial concept in economic analysis, representing the average return an investment is likely to generate over a given period. It plays a significant role in investment decision-making, enabling investors to assess the potential return and risk associated with different investment options.
Economic State Assumptions

Expected return calculations rely on assumptions about future economic states. In this analysis, we consider three economic states:
| Economic State | Probability |
|---|---|
| Recession | 0.25 |
| Moderate Growth | 0.50 |
| Strong Growth | 0.25 |
Expected Return Calculation

Expected return is calculated using the following formula:
E(R) = P1
- R1 + P2
- R2 + … + Pn
- Rn
Where:
- E(R) is the expected return
- Pi is the probability of occurrence for each economic state
- Ri is the return associated with each economic state
Example Calculation
Given the economic state assumptions above and the following return estimates:
| Economic State | Return |
|---|---|
| Recession | -5% |
| Moderate Growth | 5% |
| Strong Growth | 10% |
The expected return can be calculated as follows:
- E(R) = 0.25 – (-5%) + 0.50 – (5%) + 0.25 – (10%)
- E(R) = -1.25% + 2.5% + 2.5%
- E(R) = 3.75%
Therefore, the expected return for the investment is 3.75%.
Sensitivity Analysis
Sensitivity analysis is crucial in expected return calculations as it assesses how changes in the probability or return assumptions affect the expected return. By varying these assumptions, investors can gain insights into the potential risks and rewards associated with an investment.
Applications in Investment Analysis
Expected return is a cornerstone of investment portfolio management. It is used to:
- Allocate assets across different investment classes (e.g., stocks, bonds, real estate)
- Manage risk by diversifying the portfolio
- Evaluate the performance of investment managers
Limitations and Assumptions

While expected return is a valuable tool, it has limitations:
- It relies on assumptions about future economic states, which may not always be accurate.
- It does not account for all sources of risk, such as political instability or market volatility.
- It assumes that the probabilities and returns are independent of each other, which may not be the case in reality.
Question & Answer Hub
What is expected return?
Expected return is the average return that an investment is expected to generate over time, taking into account the probability of different economic outcomes.
How is expected return calculated?
Expected return is calculated by multiplying the probability of each economic state by the expected return in that state and then summing the results.
What are the limitations of expected return calculations?
Expected return calculations are based on assumptions about the future, which can be uncertain. Additionally, expected return does not take into account the risk associated with an investment.